Ansys LS-DYNA 非線形構造解析ソフトウェア Structure Analysis
Bézier曲線を用いた塑性ポアソン比カーブの表現
塑性ポアソン比-相当塑性ひずみ関係を2本のBézier曲線で表現しています。 コントロールポイント(グラフ中のCP2,3,5,6)の座標値を設計変数とした最適化計算を実施し、試験結果の再現を試みています。
【塑性ポアソン比カーブの例】
【Bézier曲線で定義した塑性ポアソン比カーブ )】
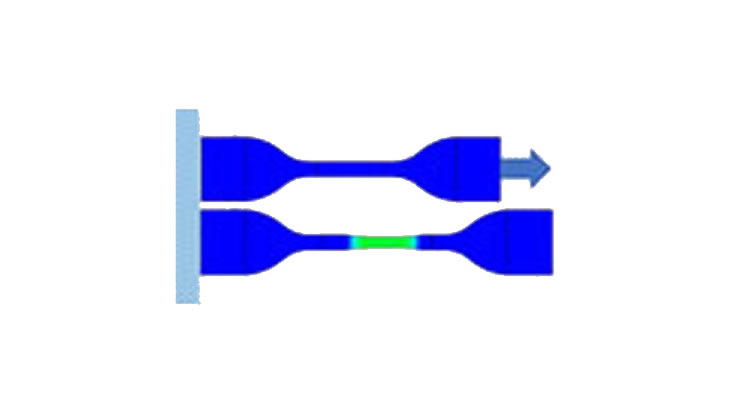
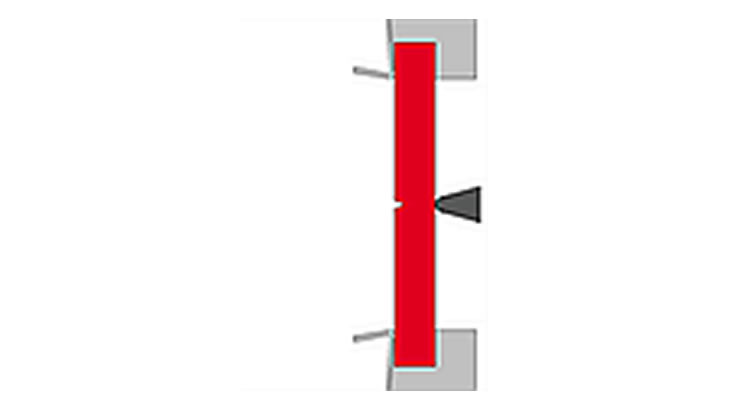
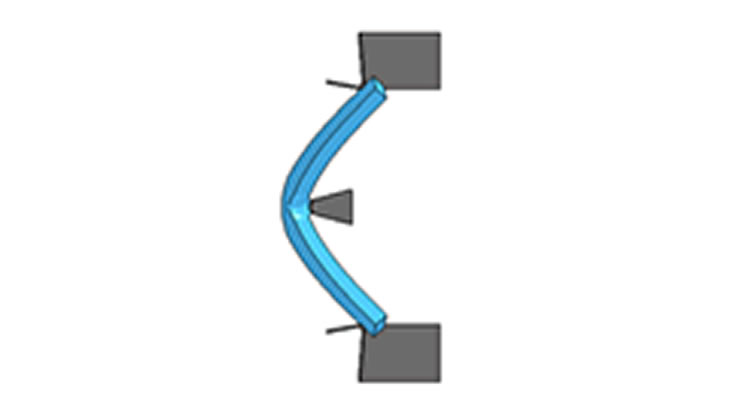
材料試験シミュレーション⇒DIC結果と比較
A点、B点の見かけのポアソン比(Apparent Poisson’s Ratio)を評価
【*MAT_SAMP-1を利用】
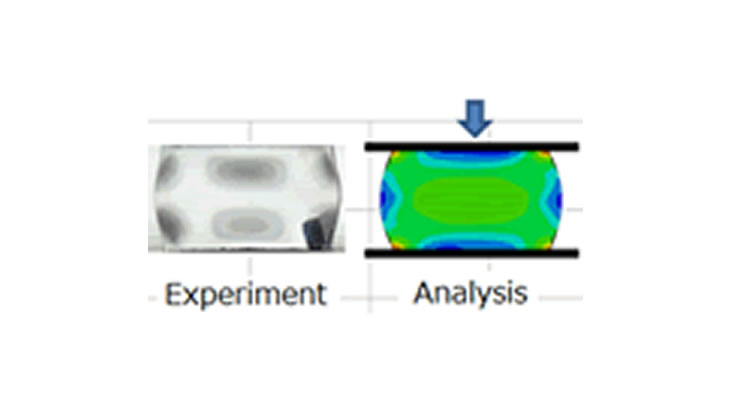
【試験結果(PC材、DIC利用)】
最適化計算による塑性ポアソン比の同定
最適化計算前
最適化計算後